
Incoming Class of 2023 Is the Most Diverse Ever, But More Work Remains
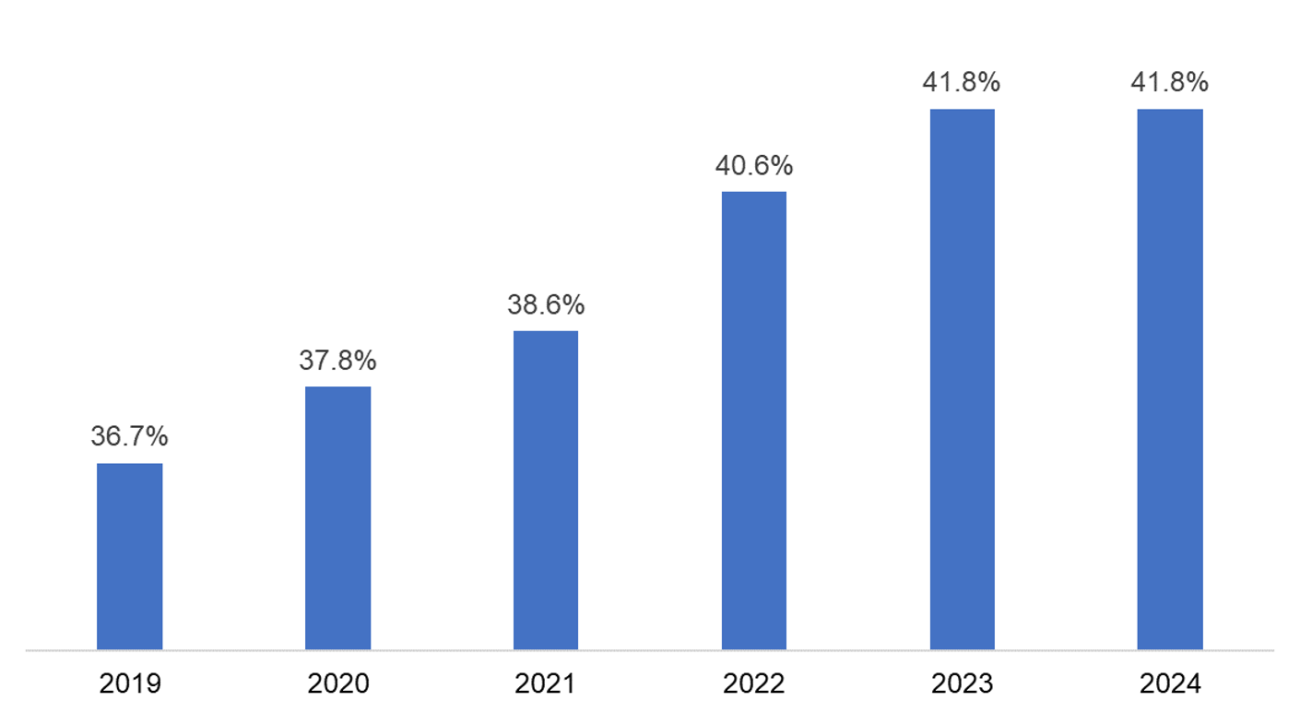
Updated, December 16, 2024: As outlined in the post below, LSAC broke out students who identified as Middle Eastern or North African/Arab as a separate category starting with the 2023 incoming class matriculant data report. In light of that fact, students who identified as having multiple racial/ethnic identities should be included in the Two-or-More category. Updating the data to reflect that fact for the six years from 2019 through 2024, students from racially and ethnically minoritized groups represented 41.8% of the incoming class of both 2023 and 2024, up from 40.6% in 2022, 38.6% in 2021, 37.8% in 2020, and 36.7% in 2019.
Matriculants Percentage Students of Color, Including Middle Eastern and North African Students and Updated Multiethnic Students, 2019 to 2024
There is much to celebrate in the ABA’s release of the demographic information for the incoming law school class of 2023. For the third year in a row, it is the most racially and ethnically diverse law school class in history.
According to LSAC's analysis, 40.2% of the class are students of color, up from 39.0% in last year’s entering class, which was at the time an all-time record. Women make up 55.8% of the entering class, the highest percentage in history. In addition, 14.7% of the class is LGBTQ+, and 24.2% of the class are first generation college, both also the highest percentages ever.
For a profession that has historically lagged on diversity and equity, each of these record setting benchmarks provides a reason to applaud. But we cannot rest on our laurels. Much work remains to be done throughout the profession, and this summer’s U.S. Supreme Court decision on race-conscious admission means we must work even harder to advance law and justice by promoting access, equity, and fairness in the profession.
The ways in which we describe, measure, and talk about diversity continue to evolve at a rapid pace and any analysis of the demographic markers that describe the incoming class of 2023 requires the careful examination of different measures and trends, but by any measure the most recent incoming law school class stands as the most diverse ever in the history of US legal education.
The ABA’s Standard 509 data provides a detailed snapshot of the size and makeup of the incoming class for each law school, including the number of students, full- and part-time status, and racial, ethnic, and gender information. This data also provides verified LSAT score and undergraduate GPAs by quartile. This data is compiled each fall by the ABA, LSAC, and all 196 ABA-accredited US law schools and is published annually by the ABA Section of Legal Education and Admissions to the Bar. What follows are some key takeaways from this year’s 509 data. Given LSAC’s deep expertise in admission and legal education, this blog post is informed by additional data compiled by LSAC that complements and expands on Standard 509 data published by the ABA.
Class Size
The incoming class includes 37,797 students, which represents a slight decrease of just 216 students nationwide. This marks a continued return to stability following the exceptionally large entering class of 2021; from 2017 onward, entering classes have been roughly 37,000-38,000 each year with the exception of 2021.
Racial and Ethnic Diversity
As noted above, by any measure the incoming class of 2023 is the most racially/ethnically diverse class ever. Historically, the ABA and LSAC have counted Middle Eastern and North African (MENA) students in the Caucasian or white category. More recently, we have started to break out Middle Eastern and North African students as a separate category. The MENA community and many diversity experts have long advocated for this change for visibility and a more accurate representation of their lived experiences.
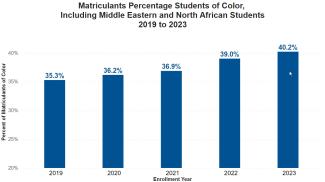
Using this updated approach, the incoming 2023 class includes 40.2% students of color, a 1.2 percentage point increase over last year’s record 39.0% figure, and up from 35.3% in 2019. As the chart below indicates, this is the third year in a row that the incoming law school class has established a new all-time record for the racial/ethnic diversity. And it’s worth noting that for all three years, 98% of these record-setting matriculants used the LSAT as part of their application process.
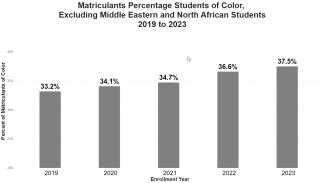
Alternatively, using the historical approach, which considers Middle Eastern and North African students within the Caucasian category, the 2023 class includes 37.5% students of color, a 0.9% increase over last year’s record 36.6% figure, and up from 33.2% in 2019.
The ABA has historically reported data on racial and ethnic diversity using a reporting method called single reporting, in which each student is only counted once, and students who identify as having more than one race or ethnicity are included in a “two or more races and/or ethnicities” category. Using a single-reporting approach1, Asian students comprise 9.6% of 2023 matriculants, compared to 8.9% in 2022 and 8.1% in 2021. Black/African American students comprise 7.7% of 2023 matriculants, compared to 7.8% in 2022 and 7.9% in 2021. Caucasian/white students comprise 56% of 2023 matriculants, down from 57.7% in 2022 and 59.5% in 2021. Hispanic/Latinx students comprise 9.4% of both 2023 and 2022 matriculants, compared to 8.8% in 2021.2
In recent years, the number of individuals who select two or more races and/or ethnicities has grown steadily, and now is the second largest matriculant group after Caucasian/white students, accounting for 11.1% of 2023 matriculants compared to 10.8% in 2022, and 10.1% in 2021.
When we explore who are the multiracial, ethnoracial, or “two or more” students, we get an even deeper understanding of the rich diversity of the incoming 2023 class. Nearly half (44.8%) of the students included in the “two or more” group selected Hispanic/Latinx as one of the races and/or ethnicities. The largest multiracial and ethnoracial groups counted in “two or more” include: Hispanic/Latinx and white (36%), Asian and white (18%), Black and white (9%), American Indian/Alaska Native and white (7%), and Black and Hispanic/Latinx (7%). Black and Hispanic/Latinx (or sometimes known as Afro-Latina/é/o/x) made up about 5% of the students identifying exclusively or in part as Hispanic/Latinx and about 7% of students identifying exclusively or in part as Black/African American.3
Adding the identities expressed by students in the “two or more” group4, we find that the proportion of entering students who identified either exclusively or in part as Asian has increased from 10.2% in 2019, to 10.4% in 2020, 10.8% in 2021, 11.9% in 2022, and 12.6% in 2023. Students identifying exclusively or in part as Black/African American have been measured at 9.5% in 2019, 9.7% in 2020, 10.0% in 2021, 10.2% in 2022, and 10.1% in 2023. Students identifying exclusively or in part as Hispanic/Latinx have increased from 13.5% in 2019, to 14.1% in 2020 and 14.0% in 2021, to 15.0% in 2022 and 15.2% in 2023.5
Understanding the myriad identities within the “two or more” group is also extremely important in understanding American Indian/Alaska Native representation in legal education; students who identify exclusively as American Indian/Alaska Native represent 0.3% of 2023 matriculants, while students who identify either exclusively or in part as American Indian/Alaska Native represent 1.7% of the incoming class. This is similarly important for matriculants who identify as Native Hawaiian or Other Pacific Islander; students who identify exclusively as Native Hawaiian or Other Pacific Islander represent 0.1% of 2023 matriculants, while students who identify either exclusively or in part as Native Hawaiian or Other Pacific Islander represent 0.5% of the incoming class. While these are relatively small percentages, these examples illustrate the significance of considering the identities within the “two or more” group.
Gender Diversity
Women once again made up more than half of the entering class, making up 55.8% of the entering class of 2023, up from 55.2% in in 2022. It is worth noting that women represented less than 50% of the entering class until 2015, and women currently represent about 38% of the overall U.S. legal profession, with significantly lower representation rates among senior job levels. Men make up 41.3% of the class of 2023, compared to 42.2% of the entering class of 2022. For this most recent entering class, 1.7% of applicants did not report a gender identity, and 1.3% reported that they were gender diverse, up from 1.1% in 2022 and 0.8% in 2021.
LGBTQ+ Diversity
Looking at LGBTQ+ diversity, including diverse sexual orientations and gender identities, 0.2% of the 2023 matriculant class self-identified as transgender, and 14.7% of the 2023 matriculants identified as LGBQ+ (i.e., not straight/heterosexual), up from 13.8% in 2022 and 11.9% in 2021.
LSAT and UGPA Trends
In aggregate, the incoming class of 2023 had higher undergraduate GPAs and LSAT scores than previous years — median GPA was up 0.02 points and median LSAT score was up 0.13 points.
Overall, 137 schools reported an increase in median GPA for their incoming class, 47 schools reported a decrease, and 12 schools reported no change. By contrast, 56 schools reported an increase in median LSAT scores, 32 schools reported a decrease, and 108 reported no change.
Why We Can’t Rest on Our Laurels
Working now as a member of the Legal Education Consulting team at LSAC, I have the privilege of walking the hallways of a variety of law schools across the country, and they really are so much more diverse than they used to be, and diverse in every way imaginable. It is thrilling to see the broad spectrum of racial, ethnic, and gender expression that is represented in today’s law schools. But we know that as successful as we have been in bringing in increasingly diverse classes, classes that more closely reflect the diversity of our society, there are additional barriers and hurdles to success that will face many members of this most diverse entering class of 2023.
We know from the most recent LSSSE report that first generation students, who are more likely to be students of color, women, older students, and part-time students, face more challenges in law school than their non-first generation peers, including reporting the need to work more hours per week and also spend more hours studying. As a result of these and other factors, attrition rates vary a great deal from group to group. For instance, ABA 509 data have consistently shown higher attrition rates for Black/African American students than for students from other racial and ethnic groups. The ABA’s bar passage data
continue to measure significant differences in pass rates by race and ethnicity, reporting most recently that the ultimate pass rate for white bar examinees in 2021 was 90%, compared with 86% among Asians, 81% among Hispanics, and 72% among Black test takers. And we know from the most recent NALP employment report
that despite a record job market for the graduating class of 2022, employment and salary outcomes remain unequal for graduates of color and for first-generation college students, sometimes starkly so. For instance, NALP reports that Black graduates, Native American and Alaska Native graduates, and Native Hawaiian and other Pacific Islander graduates continue to enter private practice at significantly lower rates than their peers from other racial and ethnic groups.
Once lawyers move into practice, we know that the disparities by group continue to grow. As NALP reported earlier this year , in 2022, people of color accounted for only 11.4% of all partners (equity and non-equity), while women comprised only 26.65% of all partners. Just over 4% of all partners are women of color, and Black and Latinx women each continued to represent less than 1% of all partners in U.S. law firms. And in addition to the volumes of quantitative data that measure ongoing inequities in the profession, qualitative studies also describe the additional burdens faced by many groups of lawyers. For instance, in November the ABA Journal reported that “Native American female lawyers often feel isolated and exhausted, and they have endured pervasive bias and harassment, according to a new report published by the ABA Commission on Women in the Profession and the National Native American Bar Association
.”
So yes, there is cause for celebration with the news that the US law school entering class of 2023 is the most diverse class ever. But there is also cause for us to dig deep to find the courage and energy to continue the hard work of ensuring that the legal profession becomes a more just and equitable profession that truly reflects the breadth of diversity in this county.
We must, each of us, redouble our efforts to promote access, equity, and fairness in the profession. LSAC, law schools, colleges and universities, and legal employers need to remain courageous and steadfast in working toward our shared goals. Here at LSAC we are intensifying our outreach efforts to attract and recruit the broadest pool of candidates to consider careers in law, particularly among groups that have been historically underrepresented in the legal profession. We are broadening our efforts to help provide aspiring law students with the skills and information they need to be successful, by expanding our Prelaw Undergraduate Scholars (PLUS) program to serve even more students, and promoting new initiatives like our Writing for Impact program, which is designed to help candidates do the most effective job possible in presenting their stories and qualifications in their essays and other application materials – something that is even more important in the wake of the Supreme Court ruling. While it is still relatively early in the application cycle for the fall 2024 incoming class, we see very positive signs. Overall, the volume of applicants is up 3.6% compared to this time last year. Importantly, the diversity of the applicant pool remains strong – the volume of applicants of color is up 5.9% compared to this time last year, women applicants are up 4.6%, and first-generation college student applicants are up 2.4%.
We will continue to work with schools and organizations across the community to help expand access, equity, and fairness in legal education, and we will provide periodic updates as the admission cycle progresses.
- The ABA and LSAC use slightly different approaches for single reporting; The ABA uses an additional category for non-resident alien matriculants, and in some cases counts certain matriculants more than once. For the purposes of this analysis, we are using LSAC’s approach, which counts each matriculant once.
- Hispanic/Latinx includes matriculants who self-identified as only Hispanic/Latinx, only Puerto Rican, or who self-selected only Hispanic/Latinx and Puerto Rican combined.
- Black and Hispanic/Latinx include anyone who selected Black and Hispanic/Latinx, Black and Puerto Rican, and Black, Hispanic/Latinx, and Puerto Rican.
- This approach to reporting racial/ethnic diversity is sometimes referred to as “maximum reporting.” Under maximum reporting, if a student identifies as two or more races, they are counted in the data reported for each of those races. For example, if a student identified as both Asian and Black, they would be counted in the statistics for both Black students and Asian students.
- The maximum reporting numbers for Hispanic/Latinx matriculants includes anyone who exclusively or in part identified as Hispanic/Latino and/or Puerto Rican.

James Leipold is a senior advisor with LSAC's Legal Education Consulting team. Prior to joining LSAC, he worked as the executive director of the National Association for Law Placement in Washington, D.C., for more than 18 years.