Incoming Class of 2022: A Major Advance in Diversity, More Work to Do
The incoming class of 2022 is by far the most racially and ethnically diverse law school class in history.
Using the ABA’s existing demographic categories, 36.6% of the incoming class of 2022 identify as students of color, a nearly 2% jump over last year’s record-setting level of 34.7% students of color. (As described later in this blog post, LSAC and the ABA have been communicating on how best to update our respective racial and ethnic reporting categories to ensure inclusive data collection and reporting in the future. Such changes include how to report Middle Eastern and North African/Arab students more accurately; these students historically have been included in the Caucasian/white category. Using more inclusive racial and ethnic reporting categories, the racial and ethnic diversity of the 2022 matriculant class is 39%, a 2.1% increase over last year’s level of 36.9%.)
More than 98% of the record-setting diverse class of 2022 matriculants used the LSAT as part of their application process.
Women continue to make up more than 55% of incoming law students, a dramatic contrast to just seven years ago, and for decades before that, when the majority of law school matriculants were men.
And with just over 38,000 students, the size of the 2022 incoming class represents a return to normalcy following the unusually large 2021 class.
These are some key takeaways from this year’s “Standard 509 External ink opens in new browser window ” law school enrollment data, compiled each fall by the ABA, LSAC, and all 196 ABA-accredited U.S. law schools, and published yesterday by the ABA Section of Legal Education and Admissions to the Bar.
The Standard 509 data provides a snapshot of the size and makeup of the incoming class for each law school, including number of students; full- and part-time status; and racial, ethnic, and gender information; as well as verified LSAT score and undergraduate GPA by quartiles. This data also provides an opportunity to look at areas of progress and emerging trends that could affect the future of legal education and our justice system more broadly.
Given LSAC’s deep expertise in admission and legal education, this blog post is informed by additional data compiled by LSAC that complements and expands on Standard 509 data published by the ABA.
Context of Recent Years
Due to the COVID-19 pandemic, the past several years have been turbulent for students and law schools alike, and LSAC has worked hard to be a source of stability and continuity.
- The pandemic disrupted the 2019-20 testing and application cycle, but the community was able to move quickly to support applicants, resulting in a successful 2020 outcome and year-over-year progress in racial/ethnic diversity.
- The 2021 cycle saw a dramatic increase in the number of law school applicants — driven in part by a resurgent drive for social and racial justice among other factors — with strong growth across nearly every racial and ethnic group. As a result, the 2021 incoming class was 9% larger than 2020. The 2021 class was the most racially and ethnically diverse ever, with 34.7% students of color.
2022 Top Takeaways
A Return to Normalcy in Overall Class Size
In terms of overall size, the incoming class of 2022 represents a return to the levels we have seen in recent years — roughly 38,000 students, about the same as every year since 2018, with the exception of the unusually large 2021 class.
Racial and Ethnic Diversity
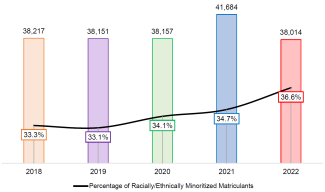
Building on the racial and ethnic diversity of last year’s class, the incoming 2022 class is by far the most racially and ethnically diverse class in history. Using the existing categories from the past five years, the 2022 class includes 36.6% students of color, a 1.9% increase over last year’s 34.7% (refer to Figure 1).
Figure 1: The Total Number of Matriculants and Percentage of Students of Color From 2018 to 2022
The ABA has historically reported data on racial and ethnic diversity using a reporting method called single-reporting, in which each student is generally only counted once, and students who identify as having more than one race or ethnicity are generally included in a “two or more races and/or ethnicities” category. Using a single-reporting approach1, Asian students comprise 8.9% of 2022 matriculants, compared to 8.1% in 2021 and 7.7% in 2020. Black/African American students comprise 7.8% of 2022 matriculants, compared to 7.9% in 2021 and 7.7% in 2020. Caucasian/white students comprise 57.7% of 2022 matriculants, down from 59.5% in 2021 and 59.8% in 2020.
Hispanic/Latinx students comprise 9.4% of 2022 matriculants, compared to 8.9% in 2021 and 9.1% in 2020.2
In recent years, the number of individuals who select two or more races and/or ethnicities has grown steadily, and now is the second largest matriculant group after Caucasian/white students, accounting for 10.1% of 2022 matriculants compared to 9.4% in 2021 and 9.3% in 2020.
When we explore who are the multiracial, ethnoracial, or “two or more” students, we get an even deeper understanding of the rich diversity of the incoming 2022 class. Nearly half (44%) of the students included in the “two or more” group selected Hispanic/Latinx as one of the races and/or ethnicities. The largest multiracial and ethnoracial groups counted in “two or more” include: Hispanic/Latinx and white (33%), Asian and white (20%), Black and white (9%), American Indian/Alaska Native and white (7%), and Black and Hispanic/Latinx (5%). Black and Hispanic/Latinx (or sometimes known as Afro-Latina/é/o/x) made up about 5% of the students identifying exclusively or in part as Hispanic/Latinx and about 7% of students identifying exclusively or in part as Black/African American.3
Adding the identities expressed by students in the “two or more” group,4 we find that the proportion of entering students who identified either exclusively or in part as Asian has increased from 10.4% in 2020 to 10.8% in 2021 to 11.9% in 2022. Students identifying exclusively or in part as Black/African American have increased from 9.7% in 2020 to 10.0% in 2021 to 10.2% in 2022. Students identifying exclusively or in part as Hispanic/Latinx have increased from 14.2% in 2020 and 14.0% in 2021 to 15.0% in 2022.5
Understanding the myriad identities within the “two or more” group is also extremely important in understanding American Indian/Alaska Native representation in legal education; students who identify exclusively as American Indian/Alaska Native represent 0.3% of 2022 matriculants, while students who identify either exclusively or in part as American Indian/Alaska Native represent 1.8% of the incoming class. This is similarly important for matriculants who identify as Native Hawaiian or Other Pacific Islander; students who identify exclusively as Native Hawaiian or Other Pacific Islander represent 0.1% of 2022 matriculants, while students who identify either exclusively or in part as Native Hawaiian or Other Pacific Islander represent 0.6% of the incoming class.
Of course, even a deeper examination of the data only scratches the surface of the rich diversity of the 2022 class — behind all of these numbers are more than 38,000 unique individuals, each with their own family heritage, lived experience, and legal education journey.
Gender Diversity
Looking at gender identity, we see a continuation of recent trends. Among this year’s entering class, 55.3% of incoming students are women, and 42.5% are men. For comparison, as recently as 2015, men comprised more than half of incoming law students.
LGBTQ+ Diversity
Looking at LGBTQ+ diversity, including diverse sexual orientations and gender identities, 0.6% of the 2022 matriculant class self-identified as transgender, gender nonbinary, or genderqueer/gender fluid, and about 14% of the 2022 matriculants identified as LGBQ+ (i.e., not straight/heterosexual). As part of our ongoing commitment to gender inclusivity and the lived experiences of students in the LGBTQ+ community, LSAC this year updated the LSAC LGBTQ+ Guide to Law Schools and LSAC’s Sexual Orientation and Gender Identity (SOGI) Subcommittee created a resource to help LGBTQ+ individuals in their law school search.
LSAT and UGPA Trends
In aggregate, the incoming class of 2022 had higher undergraduate GPAs and LSAT scores than previous years — median GPA was up 0.04 points and average LSAT score was up 0.32 points.
Overall, 144 schools reported an increase in median GPA for their incoming class, 38 schools reported a decrease, and 14 schools reported no change. By contrast, 75 schools reported an increase in median LSAT scores, 23 schools reported a decrease, and 98 schools reported no change.
The Impact of Investments in Access
The 2022 class underscores the critical importance of supporting aspiring students with technical and financial assistance, to improve access to legal education toward the long-term goal of a legal profession that reflects the full diversity of our society.
When in-person LSAT testing became a public health and safety concern due to the COVID-19 pandemic, we were able to quickly pivot to at-home administration of the LSAT. This pivot required us to take necessary steps to help ensure equity and access, recognizing that not everyone has access to a computer, a quiet place to test, or reliable internet service at their home.
To help promote access and equity, LSAC continues to provide, to anyone who requests assistance, a free loaner device or hotel reimbursement in order to have an environment in which to successfully take the LSAT.
The impact of this assistance is significant when we look at the 2022 matriculant data — in the 2022 entering class alone, 1,600 matriculants benefited from a free loaner device, hotel reimbursement, or both. And the impact on diversity was substantial. Of the matriculants who received assistance, 58.1% were people of color.6
The matriculant data also underscore the importance of the LSAC fee waiver program. More than 2,400 matriculants benefited from LSAC’s fee waiver program, and 70.5% of these matriculants were students of color.7
Obviously, LSAC is not the only organization working to assist and support prospective law students — law schools, undergraduate institutions, and other organizations are working hard to support these individuals as well. And there is more to do. But these data demonstrate how important it is for the entire legal education ecosystem to understand the needs of prospective law students and work together from the earliest possible point to address them.
Improving How We Assess and Report Diversity
How our society understands and talks about personal identity is constantly evolving. LSAC works with a wide range of groups and institutions to inform our work on diversity, equity, and access. You can learn more about the importance of data and inclusion in these blog posts by Kristin Theis-Álvarez, the chair of LSAC’s Diversity, Equity, and Inclusion Committee, and Meera Deo, who chaired LSAC’s Advisory Group on Diversity, Equity, and Inclusion (DEI) Categories.
Based on our work and understanding of inclusive data collection and reporting, we will be making some important changes in how we report racial and ethnic diversity going forward. We have been communicating closely with the ABA to help ensure that we move forward together in a consistent and coordinated manner whenever possible.
Historically, the ABA and LSAC have collected data for individuals who self-identify as Middle Eastern or North African as part of the “white” category, consistent with existing federal data-collection and reporting guidelines. Going forward, LSAC will report out individuals who identify as Middle Eastern and North African/Arab separately from individuals who identify as white. The Middle Eastern and North African/Arab community and many diversity experts have long advocated for this change for visibility and a more accurate representation of their lived experiences.
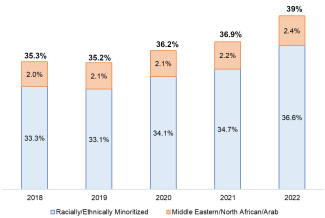
Because Middle Eastern and North African/Arab has been a subcategory, we have historical data that can provide at least a partial picture of trend data over time. Middle Eastern and North African/Arab students represented 2.0% of the 2018 entering class, rising to 2.2% in 2020, and 2.4% in 2022. Separating Middle Eastern and North African/Arab students from the Caucasian/white category, the proportion of students of color was 36.2% in 2020, 36.9% in 2021, and 39.0% in 2022 (refer to Figure 2). Including Middle Eastern and North African/Arab students, matriculant racial and ethnic diversity increased 2.1% in 2022 compared to 2021.
Figure 2: Matriculant Racial and Ethnic Diversity From 2018 to 2022 Including Middle Eastern and North African/Arab Students
We will provide additional detail on other improvements in how we assess and report on a wide range of diversity metrics in a future blog post.
Looking Ahead
We’ve now had three consecutive years of increases in the racial/ethnic diversity of the incoming law school class, and two consecutive years with the most diverse entering class in history. But we still have a long way to go to create a legal profession that reflects the diversity of society and provides full access to justice for everyone.
Hanging over this entire conversation about diversity, of course, is the likelihood that the U.S. Supreme Court will take action restricting the ability of educational institutions to consider race and ethnicity in admission. LSAC joined an amicus brief in support of continuing to allow schools to consider race and ethnicity as part of their holistic admission processes. While a decision is not expected until spring 2023 or later, LSAC will provide guidance and resources to help schools and students prepare for and navigate any changes.
Regardless of how the Court rules, we need to continue to cultivate and support the growing diversity in legal education. As part of that, we need more research on what programs, investments, and practices have helped to drive the progress of the last several years, and where more effort is still needed. We know that students from racially and ethnically minoritized communities, students with disabilities, LGBTQ+ students, first-generation college students, and students at the intersection of multiple marginalized identities face barriers at every step in their educational journeys, from preschool to college to law school and beyond, and we need to understand how best to address those barriers.
Looking forward to the incoming 2023 class, we are still somewhat early in the 2022-23 admission cycle; last year, at this point in the cycle, we had about 47% of total applicants. Overall applicants for the 2023 cycle are lower than in 2021 and 2022, but significantly higher than in 2019 and 2020. As of December 17, there are 27,721 applicants for fall 2023 admission, down 4.8% from 2022 and down 9.6% from 2021, but up more than 20% for this time in the 2019 and 2020 cycles.
Similarly, 2023 application volumes are lower than in 2021 and 2022, but significantly higher than in 2019 and 2020. As of December 17, there are 190,719 applications reported, down 4.9% from 2022 and down 8.8% from 2021, but up more than 40% from 2019 and 2020.
With regard to racial/ethnic diversity, applicants of color represent a slightly higher proportion of applicants than at this point in last year’s admission cycle. Looking at the gender distribution, women represent 56.3% of all applicants so far this year, compared to 54.9% at this point last year. Approximately 1.4% of this year’s applicants identify as gender diverse and 1.2% declined to provide their gender identification, compared to 1.2% and 1.2%, respectively, last year.
It is still early in the cycle, so we may see the current trends change in the coming months. We will continue to keep you updated on law school admission trends through this blog and through our Keeping Up to Data podcast.
1 The ABA and LSAC use slightly different approaches for single-reporting. The ABA uses an additional category for nonresident alien matriculants, and in some cases counts certain matriculants more than once. For the purposes of this analysis, we are using LSAC’s approach, which counts each matriculant once.
2 Hispanic/Latinx includes matriculants who self-identified as only Hispanic/Latinx (7.1% in 2020, 6.9% in 2021, and 7.3% in 2022), only Puerto Rican (1.3% for the last three years), or who self-selected only Hispanic/Latinx and Puerto Rican combined (0.7% in 2020, 0.7% in 2021, and 0.8% in 2022).
3 Black and Hispanic/Latinx includes anyone who selected Black and Hispanic/Latinx, Black and Puerto Rican, or Black, Hispanic/Latinx, and Puerto Rican.
4 This approach to reporting racial/ethnic diversity is sometimes referred to as “maximum reporting.” Under maximum reporting, if a student identifies as two or more races, they are counted in the data reported for each of those races. For example, if a student identified as both Asian and Black, they would be counted in the statistics for both Black students and Asian students.
5 The maximum reporting numbers for Hispanic/Latinx matriculants include anyone who exclusively or in part identified as Hispanic/Latino and/or Puerto Rican.
6 This 58.1% figure includes Middle Eastern and North African/Arab matriculants who received online testing assistance.
7 This 70.5% figure includes Middle Eastern and North African/Arab matriculants who received an LSAC fee waiver.
8 The number of Middle Eastern and North African/Arab students may be an undercount as some students opt out of selecting Middle Eastern or North African, as their identities would not be accurately represented if they were to be reported out as white.