by Gregory Camilli, Kimberly Dustman, and Ann Gallagher, LSAC
Introduction
The Law School Admission Council (LSAC) examined patterns of undergraduate grade point averages (GPAs) from year to year in order to identify longitudinal trends. These trends may differ for identifiable subgroups who, in turn, may require different academic support in undergraduate and graduate education. Differential group trends may also be informative when evaluating student potential for professional education. Very little research exists on how trends in GPA vary for students who eventually apply to law school.
For those who remain in college after the first year, it is generally the case that GPAs improve longitudinally from the sophomore to the senior years. This increase may be due to a number of factors, including (but not limited to) improving academic performance, making more informed decisions about course selection, switching majors, and grade inflation. In any case, the “freshman decline” and the subsequent rise is notable (Grove & Wasserman, 2004). In some cases, the GPA gap for underrepresented racial/ethnic groups relative to White students has been found to decrease over time with appropriate support. For example, Katz et al. (2017) implemented a program for students consisting of early faculty-mentored research opportunities and other instructional activities. At the end of the program, they found no evidence of a GPA gap between students from underrepresented racial/ethnic groups and White students.
The current LSAC study is the first in-depth study to focus on yearly GPAs for law school applicants. GPA increases were observed across the years of undergraduate study, but the rates of these increases varied according to several factors. GPA increases, especially in the last year of study, were greater for female applicants, first-generation applicants, and applicants with lower LSAT scores.
Study
The following analysis was based on a sample of 117,000 American Bar Association (ABA) law school applicants applying for admission in the 2018–2019 and 2019–2020 academic years. The sample was restricted to applicants with undergraduate transcript records showing grades for 4 to 6 undergraduate years (i.e., applicants were eliminated if it took them more than 6 years to complete their undergraduate degree). This resulted in a final sample size of 71,793 applicants (approximately 60% of the original sample). Virtually all of these students graduated from college. In the analysis below, GPAs were examined for students who earned at least 12 credits per year. Note that for most candidates, GPA data for individuals maps onto a typical 4-year cycle from freshman to senior year. Other candidates were “prorated” to this scale because they graduated either in fewer years, or in more years provided that no more than 6 years were required to complete their degree. Note that the charts and tables below depict median, not cumulative, GPA. These statistics were computed for all applicants, not just those eventually matriculating at a law school.
Below, several charts are provided depicting GPA trends for a number of different applicant subgroups. Patterns are broken out by gender, race/ethnicity, Pell Grant recipient status, first-generation status, and eventual Law School Admission Test (LSAT) score quintile. (Quintiles simply divide the score continuum into five score bands, each section holding 20% of the LSAT scores for the larger sample of applicants used in this study.) In general, all subgroups show increases in GPA over time, but the patterns vary. As shown in Figure 1, increases in GPA are evident for both male and female applicants, but these increases are greater for female applicants compared to male applicants from Year 3 to Year 4. Table 1 contains the median GPAs illustrated in Figure 1.
Figure 1. Median GPA by gender and academic year
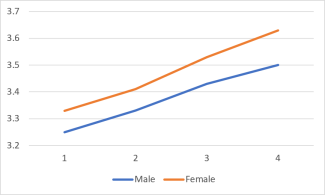
Table 1. Median GPA by gender and academic year
|
Year |
Male Applicants |
Female Applicants |
|---|---|---|
|
1 |
3.25 |
3.33 |
|
2 |
3.33 |
3.41 |
|
3 |
3.43 |
3.53 |
|
4 |
3.50 |
3.63 |
It can be seen in Table 1 that in the first year of undergraduate study, female applicants had a higher median GPA than male applicants by .08 units on a 1–4 GPA scale. By the fourth year of undergraduate study, the difference had increased to .13 units. It can also be seen that GPA increased slightly more for female than for male applicants from Year 3 to Year 4 (.10 versus .07 units).
A similar pattern can be seen in Figure 2 with increasing GPAs across the years. All racial/ethnic groups tend to have increases of the same magnitude from Year 1 to Year 4. In Table 2 it can be seen that there is some variation between the different groups, with the largest difference between Hispanic applicants and Asian or White applicants.
Figure 2. Median GPA by race/ethnicity and academic year
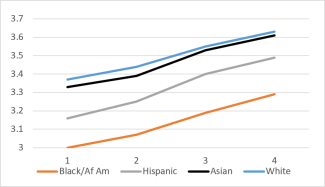
Table 2. Median GPA by race/ethnicity and academic year
|
Year |
Black |
Hispanic |
Asian |
White |
|---|---|---|---|---|
|
1 |
3.00 |
3.16 |
3.33 |
3.37 |
|
2 |
3.07 |
3.25 |
3.39 |
3.44 |
|
3 |
3.19 |
3.4 |
3.53 |
3.55 |
|
4 |
3.29 |
3.49 |
3.61 |
3.63 |
Figure 3 shows median GPA trends by Federal Pell Grant status. Median gains from Year 3 to Year 4 for recipients and nonrecipients are similar.
Figure 3. Median GPA by Federal Pell Grant status and academic year
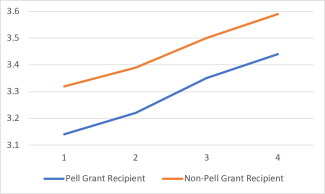
Table 3. Median GPA across time for applicants by Pell Grant status and academic year
|
Year |
Pell Grant Recipient |
Non-Pell Grant Recipient |
|---|---|---|
|
1 |
3.14 |
3.32 |
|
2 |
3.22 |
3.39 |
|
3 |
3.35 |
3.50 |
|
4 |
3.44 |
3.59 |
Figure 4 contains median GPAs by first-generation status. This information has only recently become available from the Post-LSAT Questionnaire (PLQ). As such, the sample size for this analysis was much smaller (about 25% of the total sample). As shown in Table 4, median gains from Year 3 to Year 4 were higher for first-generation applicants than for other applicants (.13 versus .09). In absolute terms, the median GPA for first-generation applicants increased from 3.14 to 3.50.
Figure 4. Median GPA by first-generation status and academic year
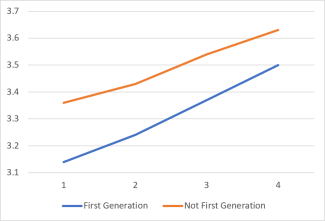
Table 4. Median GPA by first-generation status and academic year
|
Year |
First Generation |
Not First Generation |
|---|---|---|
|
1 |
3.14 |
3.36 |
|
2 |
3.24 |
3.43 |
|
3 |
3.37 |
3.54 |
|
4 |
3.50 |
3.63 |
Figure 5 below shows the progression of median GPA for law school applicants across 4 years of undergraduate study divided into five quintiles (Q1–Q5) based on individual LSAT scores.
Figure 5. Median GPA for LSAT quintile plotted by academic year
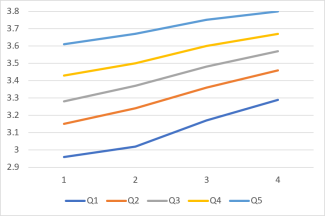
Note: The lines represent 4 years of median GPA for applicants scoring in Q1 (120–147, dark blue), Q2 (148–152, red), Q3 (153–157, gray), Q4 (158–163, yellow), and Q5 (164–180, light blue).
Table 5. Median GPA by LSAT quintile and academic year
|
Year |
Q1 120–147 |
Q2 148–152 |
Q3 153–157 |
Q4 158–163 |
Q5 164–180 |
|---|---|---|---|---|---|
|
1 |
2.96 |
3.15 |
3.28 |
3.43 |
3.61 |
|
2 |
3.02 |
3.24 |
3.37 |
3.50 |
3.67 |
|
3 |
3.17 |
3.36 |
3.48 |
3.60 |
3.75 |
|
4 |
3.29 |
3.46 |
3.57 |
3.67 |
3.80 |
For all quintiles, there is an upward trend in GPA from Year 1 to Year 4. The improvement is largest for applicants in the first (lowest) quintile. The improvement decreases from the first to the fifth (highest) quintile; however, it should be noted that there is less room to improve at Q5 than at Q1.
Conclusions
When looking at cumulative grade point average, it’s important to keep in mind that annual GPA for most law school applicants increases from Year 1 to Year 4 of undergraduate study, with greater increases for female applicants, first-generation applicants, and applicants whose LSAT score is in the bottom 40%. However, the trends shown in this paper do not imply that all applicants within a subgroup share the same general trend. Individual-level patterns may differ due to particular cognitive skills, or to noncognitive behaviors such as persistence and maturation.
The LSAT measures the skills identified by law school faculty as highly important to students’ success in law school required courses. Thus, LSAT quintile performance offers a skills-based understanding of trends. Personal characteristics, such as gender or first-generation status, may also provide useful information. In general, trend information may provide law school admission officers with important context for considering the strengths of individual applicants. The trends shown in this study may corroborate other growth indicators—such as persistence, maturation, or student development—over the course of undergraduate school. Status measures such as 4-year UGPAs and LSAT scores are more like snapshots at the endpoint of undergraduate education. In contrast, growth indicators provide a developmental perspective. Status measures and growth indicators are useful but distinct indicators of student performance and potential.
In sum, a better understanding of the factors affecting undergraduate development may lead to more relevant prelaw academic advice. Student maturation across undergraduate years may provide insights for more effective admission decisions.
Future Research
In this study, GPAs were computed by year, not semester, due to how GPAs are reported in the LSAC database. Grove and Wasserman (2004) showed that if GPA is examined by semester, a noticeable dip occurs in the second semester of undergraduate school. At this point, we don’t know whether this result generalizes to law school applicants, who tend to have higher GPAs than the general population of undergraduates. Moreover, narrower measures of GPA, such as junior-senior year GPAs, tend to correlate slightly better with first-year performance in postgraduate programs; however, the studies supporting this conclusion are somewhat dated. It also would be interesting to examine how well different combinations of undergraduate performance predict first-year performance in law school. As noted above, increasing yearly GPAs may be due to a number of factors, including improving academic maturity, making more informed decisions about course selection, or switching undergraduate majors. Finally, it is important to reiterate that these issues involve median GPA trends, not GPA trends for individual applicants.
The comparison of any two groups is not affected by grade inflation because the median GPA increment due to potential inflation is presumably the same for both groups. However, when tracking any one group, grade inflation may have an effect. Grove and Wasserman (2004) estimated an annual increase of .022 units on a 1–4 scale for cumulative GPA. To date, a grade inflation analysis has not yet been carried out for law school applicants.
References
Grove, W. A., & Wasserman, T. (2004). The life cycle pattern of collegiate GPA: Longitudinal cohort analysis and grade inflation. The Journal of Economic Education, 35(2), 162–174.
Katz, L. A., et al. (2017). A program aimed toward inclusive excellence for underrepresented undergraduate women in the sciences. CBE Life Sciences Education, 16(1), ar11. http://doi.org/10.1187/cbe.16-01-0029
To learn more about the 15 skills that were rated as most important by law faculty for law students’ success, download The LSAT Skills Analysis Study.