The Incoming Class of 2021 — The Most Diverse Law School Class in History
When we wrote last year about the incoming class of 2020, we called the 2020 law school admission cycle a “one-of-a-kind year” in which the COVID-19 public health crisis had initially disrupted the application process, but ultimately we saw a strong rebound in applicants and a successful admission cycle, thanks to the tenacity of our candidates and the hard work of so many people throughout legal education.
Well, as everyone knows, the 2021 admission cycle was also a “one-of-a-kind year,” but in a much different context. Overall applicant volumes were the highest we’ve seen in a decade, with strong growth in applicants across the board, but most importantly, a marked increase in applicants from minoritized groups. It all adds up to a historic milestone — the most racially diverse entering law school class in history.
Each fall, LSAC works closely with the ABA Section of Legal Education and Admissions to the Bar and member schools to compile enrollment data for the incoming class of law students. This aggregated “Standard 509 ” data provides a snapshot of the size and make-up of the incoming class, including number of students; full- and part-time status; and racial, ethnic, and gender information; as well as verified LSAT score and undergraduate GPA by quartiles for each law school. This data also provides an opportunity to look at areas of progress and emerging trends that could affect the future of legal education and our justice system more broadly.
Top Takeaways
Due to the COVID-19 pandemic, the resurgent drive for social and racial justice, and many other factors, we saw a dramatic increase in the number of law school applicants, with strong growth across nearly every racial and ethnic group. Many schools saw significant increases in applicants, and significant increases in highly qualified applicants.
The incoming class of 2021 is the largest incoming class in nearly a decade — roughly 41,700 first-year students, representing a more than 9% increase over the 2020 incoming class.
The incoming class of 2021 is also the most racially diverse class in history — 34.7% are students of color, representing an increase of of nearly 1,500 matriculants of color.
Between 2020 and 2021, 148 schools reported an increase in their incoming class size, while three schools remained unchanged and 45 recorded slight reductions in class size.
When using single reporting, the reporting method currently used by the ABA, people of color represent 34.7% of 2021 matriculants. (The ABA and LSAC use slightly different approaches for single-reporting; The ABA uses an additional category for non-resident alien matriculants, and in some cases counts certain matriculants more than once. For the purposes of this analysis, we are using LSAC’s approach, which counts each matriculant once.) Black/African American students comprise 7.9% of 2021 matriculants, compared to 7.6% in 2020 and 7.4% in 2019. Hispanic/Latinx students comprise 6.9% of 2021 matriculants, compared to 7.1% in 2020 and 6.9% in 2019.
When using maximum reporting, LSAC’s preferred reporting method because it captures all the racial and ethnic categories in which a candidate self-identifies, Black/African American students comprise 10.0% of 2021 matriculants, up from 9.7% in 2020 and 9.5% in 2019. Hispanic/Latinx students make up 12.3% of this year’s incoming class, compared to 12.4% in 2020 and 11.8% in 2019.
Looking at gender identity, we continue to see steady growth in the proportion of women entering law school. This year, 57.4% of incoming students are women. For comparison, as recently as 2015, men comprised more than half of incoming law students. We are also seeing steady increase in the number of candidates who identify as nonbinary or who decline to state their gender.
In aggregate, the incoming class of 2021 had higher undergraduate GPAs and LSAT scores than previous years — median GPA was up 0.05 points and average LSAT score was up 1.27 points. Several factors account for the increase in LSAT scores: the significant spike in the number of test takers, resulting in a larger number of high scores; people with high scores tend to apply; and, perhaps most importantly, test takers reported spending on average 25% to 30% more time preparing due to COVID-19 lockdowns. As a reminder, LSAT scores are not curved to meet a predetermined distribution, so if test takers prepared more, and performed better, that will result in more high scores. The length of the test does not appear to be a factor; LSAC analyses found no significant performance difference between test takers who took the same test sections in the three-section LSAT-Flex, the four-section online LSAT, or the five-section in-person LSAT.
Overall, 159 schools reported an increase in median GPA for their incoming class, 25 schools reported a decrease, and 12 schools reported no change. Similarly, 167 schools reported an increase in median LSAT scores, 4 schools reported a decrease, and 25 reported no change.
The Impact of Investments in Access
Beyond the topline numbers which reflect a successful 2021 admission cycle, supporting candidates with technical and financial assistance is of utmost importance in order to reach the overarching goal of increasing, and improving, access to legal education.
When in-person LSAT testing became a public health and safety concern due to the COVID-19 pandemic, we were able to quickly pivot to in-home administration of the LSAT. This pivot required us to take necessary steps to help ensure equity and access, recognizing that not everyone has access to a computer, a quiet place to test, or reliable internet service at their home.
To help promote access and equity, LSAC provided, to anyone who requested assistance, a free loaner device or hotel reimbursement in order to have an environment in which to successfully take the LSAT.
The impact of this assistance is significant when we look at the matriculant data. Nearly a thousand matriculants benefited from a free loaner device, hotel reimbursement, or both. And the impact on diversity was substantial. Of the matriculants who received assistance, 57.3% were people of color.
The matriculant data also underscore the importance of the LSAC fee waiver program. Nearly 2,000 matriculants benefited from LSAC’s fee waiver program, and 71% of that population were people of color.
Obviously, LSAC is not the only organization working to assist and support candidates — schools and other organizations are working hard to support candidates as well. And there is more to do. But these data demonstrate how important it is for the entire legal education ecosystem to understand the needs of prospective candidates and work together from the earliest possible point to address them.
Trends to Watch
At around 42% into the 2022 application cycle, according to LSAC data, we continue to see high overall volumes of applicants and applications, with strength across nearly all racial and ethnic groups. Although the current numbers are not quite as high as the super-heated 2021 admission cycle, they’re still significantly higher than the 2018-2020 cycles.
As of December 14, overall applicants for the 2022 cycle are down 4.9% compared to this time in 2021, but up around 31.4% compared to 2020.
We are seeing a similar pattern for most racial and ethnic groups. Black/African American applicants are down 1.6% from 2021, but up 43.2% from 2020. Hispanic/Latinx applicants are still up 3.1% from this time in 2021, and up 41.9% from 2020.
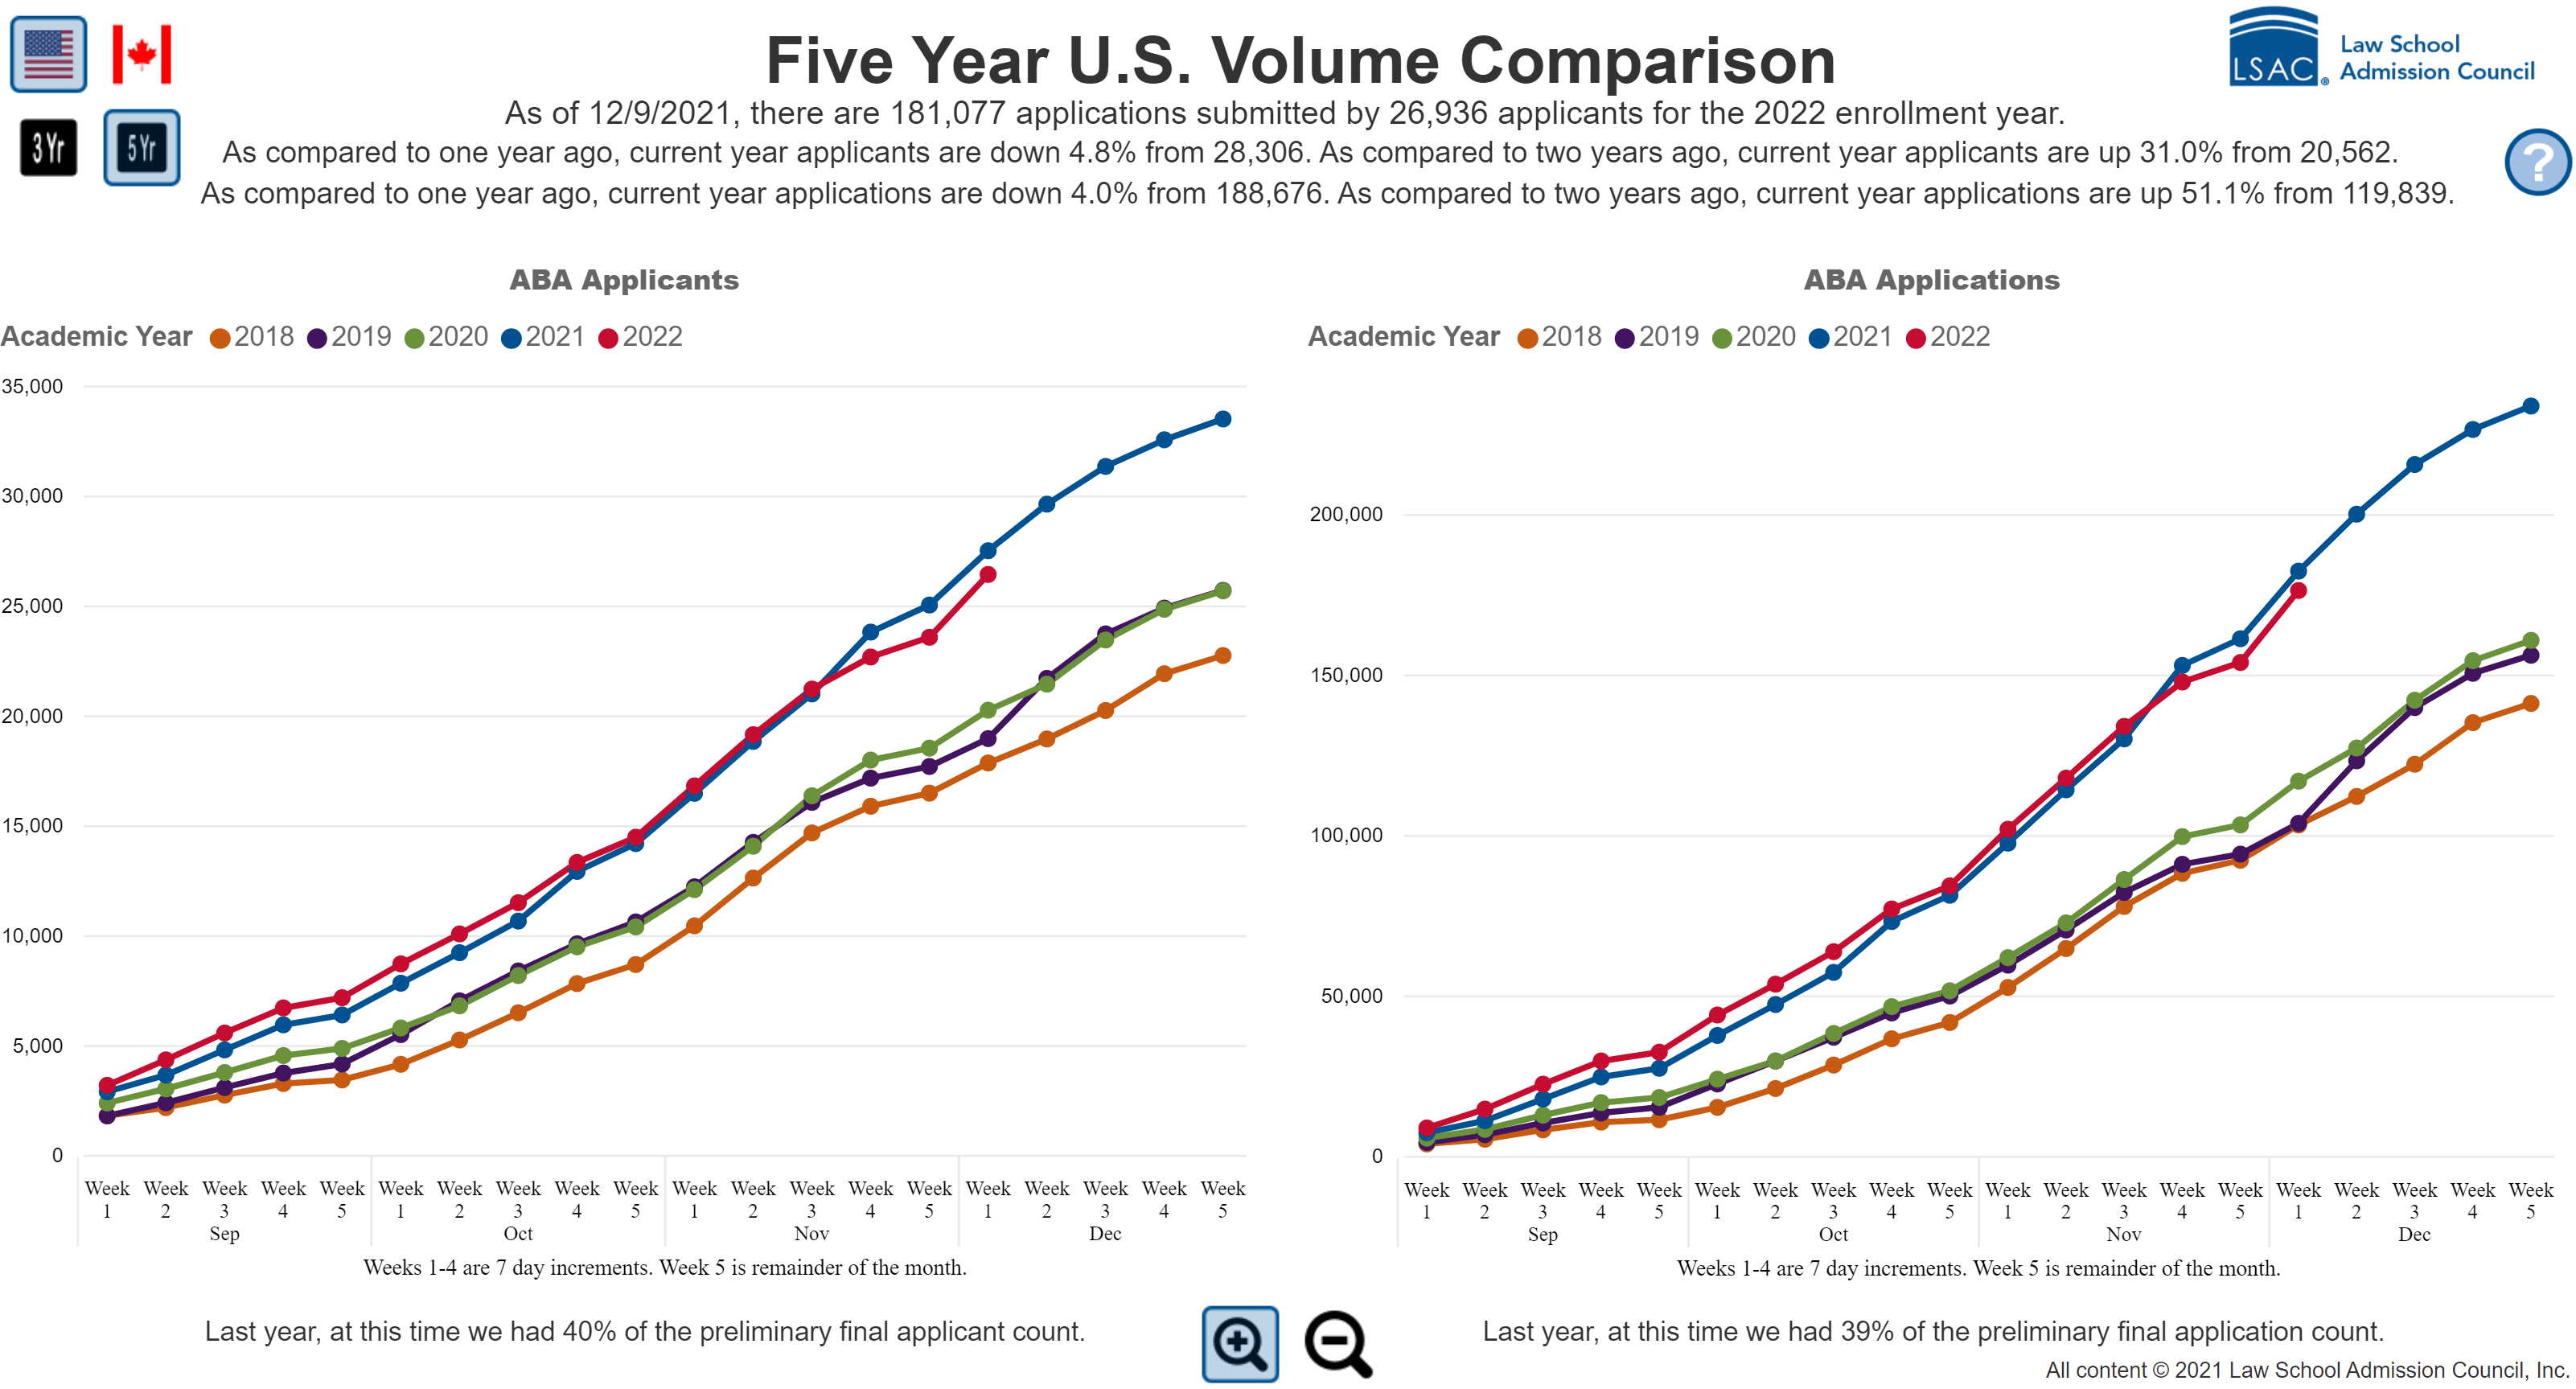
Five Year U.S. Volume Comparisons for ABA Applicants and ABA Applications
As of 12/9/2021 there are 181,077 applications submitted by 26,936 applicants for the 2022 enrollment year. As compared to one year ago, current year applicants are down 4.8% from 28,306. As compared to two years ago, current year applicants are up 31.0% from 20,562. As compared to one year ago, current year applications are down 4.0% from 188,676. As compared to two years ago, current year applications are up 51.1% from 119,839.
Last year, at this time we had 40% of the preliminary final applicant count and 39% of the preliminary final application count.
It is still early in the cycle, so we may see the current trends change in the coming months. Nonetheless, we anticipate fall 2022 applicant volumes to be closer to fall 2021 volumes than to the volumes of previous years. We also expect law schools to respond accordingly to this surge in applicants, with a careful eye toward the job market for JD graduates. We will continue to keep you updated on law school admission trends through this blog and through our Keeping Up to Data podcast.