Sizing up the 2019 Incoming Class – What Do the Numbers Tell Us?
Also available from the TaxProf Blog.
December is a busy time in legal education – from students preparing for finals, to candidates preparing their applications, to deans and admission officers building their incoming classes for 2020. This is also the time of year when enrollment data for 2019’s incoming class is finalized, which provides an opportunity to highlight factors that led to those results, spot emerging trends, and look at what’s coming down the pike.
Over the past several months, LSAC has worked closely with the ABA’s Section of Legal Education and Admissions to the Bar and law schools across the United States, to compile and verify a robust set of aggregated data about the size and make-up of the incoming class of students at each school. The data include class size, full- and part-time status, racial, ethnic and gender information, as well as LSAT score and undergraduate GPA by quartiles for each institution. The data has now been published on the ABA’s website, located here. In addition, the data for each law school is published on their individual websites as their Standard 509 Report.
Key Data Points
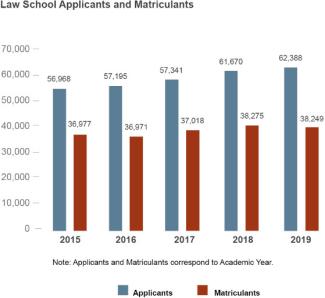
This year’s aggregated data continue to show some positive trends for legal education and raise a number of issues meriting attention. The total number of students enrolled in JD programs increased by 1.2 percent over last year, and enrollment across JD, LLM, masters and certificate programs increased by 2.1 percent from 2018. This positive but modest growth continues a welcome trend of rising JD applications that began roughly three years ago. As I wrote in an August 2019 blog, total applicants for the 2019 entering class were up 3.3% compared to 2018, and up 11.6% compared to 2017. And while we are still in the early stages of the current admission cycle, this year the number of applicants is tracking with last year’s pace (and 11.6% ahead of 2017), and the number of applications is running about 4.0% ahead of 2018 (and 11.2% ahead of 2017). LSAC updates current year applicant and applications data daily and provides a monthly podcast, Keeping Up to Data, on lsac.org.
As the data published today show, the overall size of the incoming JD class held relatively stable for the past several years – 38,285 this year, compared to 38,390 last year, and just over 37,000 in 2015. Between 2018 and 2019, the incoming class size was larger or unchanged at 119 schools, and smaller at 84 schools.
We are seeing a slow but steady rise in matriculants’ undergraduate GPAs and LSAT scores. Median LSAT scores increased at 97 law schools between 2018 and 2019, decreased at 10 schools, and remained the same at 92. Similarly, median GPA increased at 146 law schools, decreased at 45, and remained the same at 8.
In terms of demographic trends, we continue to see steady growth in the proportion of women entering law school. This year, 53.3% of incoming students are women, compared to 44.5% men (2.2% declined to state their gender). For comparison, as recently as 2015, men comprised more than half of incoming law students, but the proportion of women has increased steadily over the past five years. We recently expanded the range of gender identity categories in an effort to better address the true range of self-identification that our candidates have, and we will share trend data across these expanded categories going forward.
The percentage of students from each of the major racial and ethnic groups admitted to JD programs continues to track closely with the percentages of college graduates within those same groups and has remained relatively stable over the past five years. According to our data, Asian students comprised 9.4% of the 2019 incoming class, compared to 9.2% in 2018 and 9.2% in 2015. African American students made up 8.0% of this year’s incoming class, down from 8.3% in 2018 and 9.5% in 2015. Caucasian/White students comprised 62.5% of this year’s incoming class, compared to 65.3% in 2018 and 63.7% in 2015. Hispanic/Latinx students made up 11.1% of incoming students this year, up from 10.8 percent last year and 10.4% in 2015. We are also seeing an increase in the number of students choosing not to indicate their race/ethnicity.
Trends to Watch
The data on racial and ethnic composition of entering JD classes underscores the critical ongoing need for pipeline building programs that reach back to high school and college to encourage and support diverse candidates in seeking a legal education. LSAC works with its member law schools in multiple ways to build the justice pipeline, including programs and campaigns such as Discover Law, Be Indivisible, national Law School Forums that attracted over 7,200 attendees this fall, Pre-Law Undergraduate Scholars (PLUS) programs at over 30 locations every summer, Historically Black Colleges and Universities (HBCUs) Tours, and more. We are repeating our “How to Apply to Law School” webinar Tuesday, December 17; there were 4,000 registrants in October and this month’s registrants are already nearing 3,000. I invite you all to tune in and am grateful for the involvement of the law deans and my co-host, Ken Randall of iLaw, in expanding learning about law and legal education.
This year’s report also highlights a vital and continuing calibration between law school class sizes and the legal job market. During and after the Great Recession, we saw a number of schools having to make difficult choices and tradeoffs regarding the balance of class sizes and credentials, downsizing of faculty and staff, shifts in priorities, and increased reliance on fundraising even for core operational expenses. As a former dean during those difficult years, I know first-hand how much pressure law schools may feel to now expand enrollment, and so it is especially noteworthy and healthy to see law schools being cautious to help improve the employment prospects for graduates. As the National Association for Law Placement has well documented, it is the reduced number of JD graduates, not an increase in the number of legal jobs, that has improved employment outcomes.
Law schools are increasingly educating larger numbers of students in programs other than the JD, as well. Master’s and certificate programs now make up 15% of all law school enrollment which tells us that legal education is attractive to people who want to advance their goals in many fields, particularly those industries that are highly regulated or where job performance benefits from legal knowledge (e.g., human resources, compliance, government contracts, technology and privacy). Many candidates also rightly see legal knowledge and the acquisition of the problem-solving skills that are legal education’s hallmark as a way to assume greater responsibility within their chosen industry, advance their careers, and improve their organization’s overall performance.
Not surprisingly, we also see increases in online programs – JD, Master’s and LLM, which are particularly appealing to people who are balancing family and work, who may be returning from the military to civilian life, or who are geographically bound. These programs are important to increase access to learning about law. As an organization deeply committed to excellence in assessment, LSAC is encouraged by the high quality of learning and assessment in new hybrid JD programs.
These are just a few of the trends that we see in the applicant and matriculant data published today, and we will continue to update the data and trends as this year’s cycle progresses. While we are seeing a welcome stability over the past couple of years, our member schools are continuing to innovate to meet the demands of a changing marketplace for law and legal services and we are all advocating for more diversity in the profession. It’s an exciting time for our community as savvy candidates are recognizing the tremendous opportunities to make a positive difference in the world that legal education provides.